Watch These GameStop Price Levels as Stock Has Bucked Broader Sell-Off
Key Takeaways
GameStop ( GME ) shares rose again today after surging 11% on Friday, as the stock has largely avoided the broader sell-off in equities fueled by concerns about tariffs.
Shares in the video game retailer and meme stock surged to close out last week on news that CEO Ryan Cohen increased his stake in the company , with a regulatory filing revealing he purchased 500,000 shares, taking his total stake to more than 37 million shares, or roughly 8.4% of GameStop’s outstanding shares .
Through Monday’s close, GameStop shares have lost about 23% of their value since the start of the year. The stock had rallied to a two-month high in late March after the retailer announced it had added bitcoin to its corporate investment policy , before paring gains.
Below, we take a closer look at GameStop’s chart and use technical analysis to point out crucial levels worth watching amid the potential for further sudden price swings.
Falling Wedge Retrace
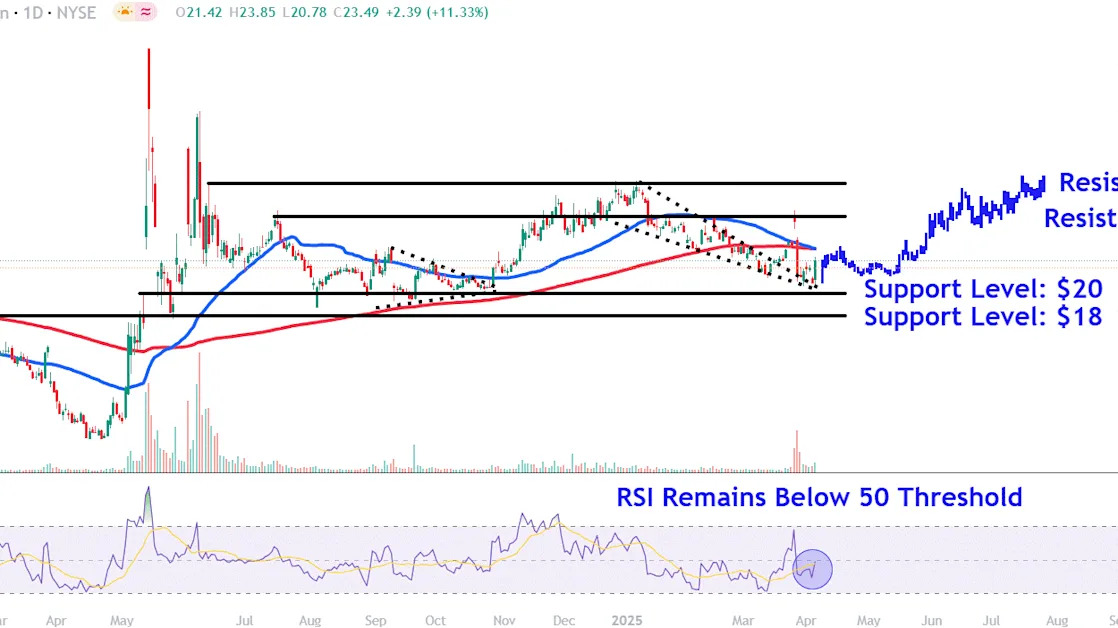
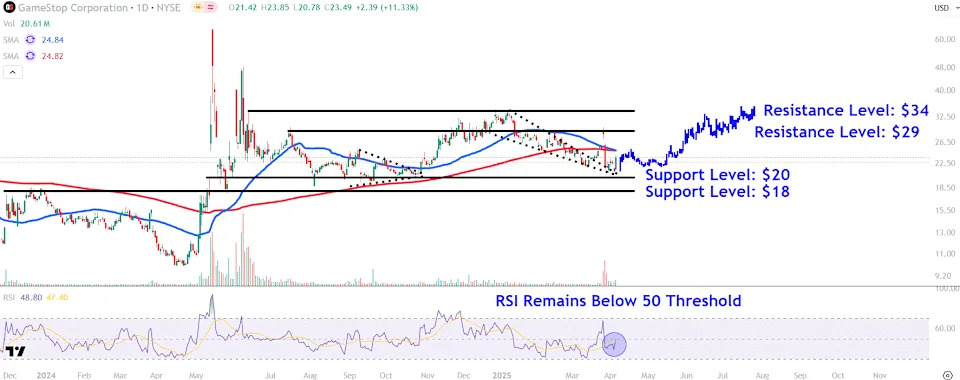
After breaking out above a falling wedge pattern last month, GameStop shares rallied sharply before completely retracing the move.
More recently however, the stock found buying interest near the falling wedge pattern’s top trendline, completing a bullish engulfing pattern in Friday’s trading session. However, a looming death cross on the stock’s chart sends conflicting technical signals.
Meanwhile, Friday’s unexpected rally coincided with the relative strength index (RSI) turning higher, though the indicator remains below the 50 threshold, signaling lackluster price momentum.
Let’s identify crucial support and resistance levels on GameStop’s chart that investors may be monitoring.
Crucial Support Levels Worth Watching
The stock rose 3.4% on Monday to close at $24.29.
In terms of support, it’s worth watching the $20 level. This area on the chart, just beneath the April low, could attract buying interest near a trendline that connects the top of a shooting star pattern last May with prominent troughs that formed on the chart in August and September.
Selling below this level could see the shares retrace to around $18. Investors may seek entry points in this region near a range of corresponding trading activity on the chart between November 2023 and May last year.