S&P 500 Pushed to Breaking Point as Trump Trade War Grips Stocks
(Bloomberg) -- The S&P 500 Index is on the brink of a crucial technical inflection point that threatens a longer-term wipeout after President Donald Trump imposed the steepest American tariffs in a century.
Most Read from Bloomberg
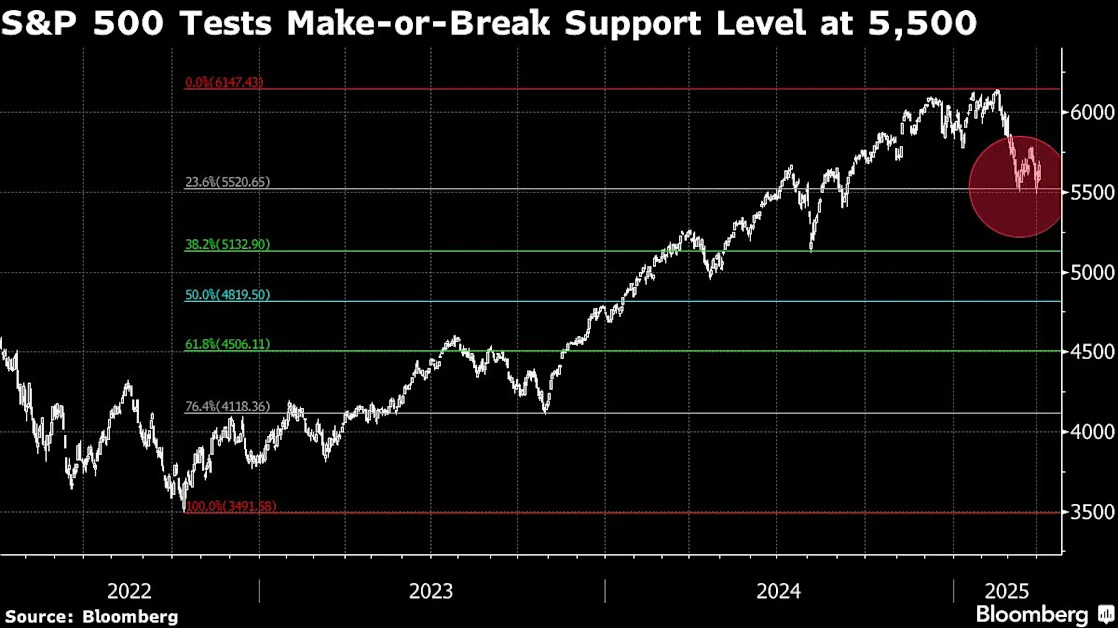
The index’s more than 3% tumble at the open puts the American equities benchmark roughly at the correction level of around 5,500. If it holds, there are few levels beneath that key psychological threshold to lure dip buyers, according to technical analysts, who monitor daily averages and other metrics to determine market momentum.
Wall Street pros have been waiting for the “Trump put,” to arrive, meaning they expected the president to step in and stop any significant damage to the stock market. But he caused this selloff. So traders are now watching key technical levels, since that positioning can dictate the stops and starts in near-term price action when technicals and economic outlooks are out the window.
“There is a whiff of panic in the air,” said Jay Woods, chief global strategist at Freedom Capital Markets. “Trump and Bessent are trying to sell this trade war to Americans, but the stock market isn’t buying it. People are sick of this rhetoric, they don’t see how tariffs will do anything but potentially throw the US into a recession and now are rushing to yank their money out of the market.”
If the S&P 500 fails to hold around 5,500, it risks sliding down to the 4,900 to 5,300 range. That has strategists thinking of their year-end targets. For example, that degree of a drop would make RBC Capital Markets’s year-end S&P bear case of 5,550 more likely than its current price target of 6,200, according to Lori Calvasina, head of US equity strategy at the firm.
During the last trade war in 2018 and 2019, equities positioning fell to the bottom of its historical band. In today’s terms, the S&P 500 would need to sink to 5,250 — a drop of more than 7% from Wednesday’s close of 5,670.97, Deutsche Bank AG data show. Beyond that, technical traders are eyeing 5,119.26 — the S&P’s Aug. 5 low when the unwinding of the yen carry trade rattled markets.
Another key level to watch is how far the S&P 500 falls below its 200-day moving average around 5,762, Woods said. The index snapped a streak of 336 sessions above the threshold last month, and was 2% below at Wednesday’s close. In prior selloffs in 2022, 2020 and 2018 it dropped more than 10% below that support line.