Watch These D-Wave Quantum Price Levels After Stock Surges to Highest Level Since 2022
Key Takeaways
D-Wave Quantum ( QBTS ) shares may remain on watchlists Tuesday after surging to a multi-year high today as investors continued to pile into the stock following news last week that the company's quantum computer outperformed a supercomputer .
D-Wave said in a press release last Wednesday that its annealing quantum computer outperformed one of the world’s most powerful classical supercomputers in solving complex materials discovery problems. CEO Alan Bratz said that the company's quantum computer can now exceed the performance of the most powerful supercomputers.
Since last week’s announcement, D-Wave shares have nearly doubled. The stock has soared more than 400% over the past 12 months amid growing interest in the quantum computing sector.
D-Wave shares gained 10% on Monday, closing at $11.18, their highest level since August 2022.
Below, we take a closer look at the technicals on D-Wave’s chart and identify important price levels that investors may be watching.
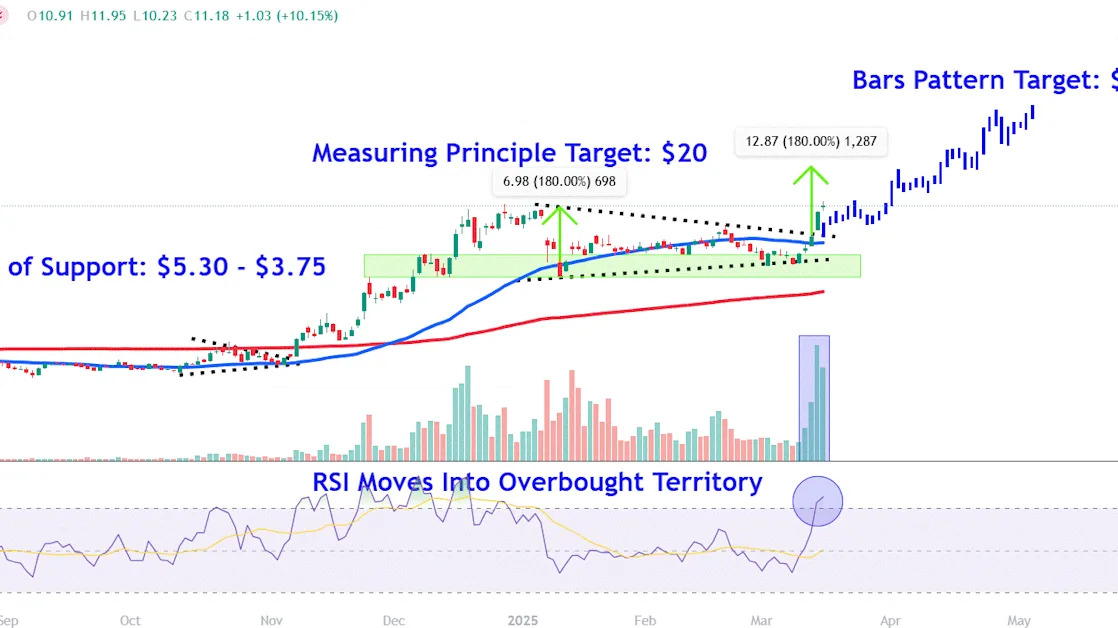
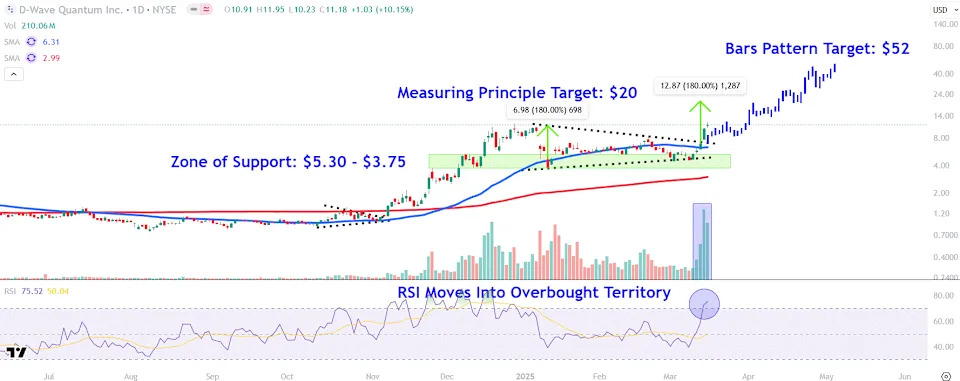
Symmetrical Triangle Breakout
D-Wave shares consolidated within a symmetrical triangle for several months before breaking out above the pattern’s upper trendline in Friday’s trading session, setting the stage for a continuation of the stock’s move higher.
Importantly, increasing volume has backed the move higher, indicating strong buying conviction behind the breakout. Moreover, the relative strength index (RSI) confirms bullish price momentum, though the indicator has moved into overbought territory, raising the possibility of short-term profit-taking.
Let’s apply technical analysis to project two potential bullish targets to watch on D-Wave’s chart and also point out an important zone of support worth monitoring during retracements.
Chart-Based Bullish Price Targets
Measuring Principle Target
When using the measuring principle to forecast a target, we calculate the percentage change of the symmetrical triangle near the start of the pattern and add it to the breakout point. For example, we apply a 180% increase to $7.15, which projects a bullish target of $20.