Stocks Tumble Into Correction as Trump Policies Roil Sentiment
(Bloomberg) -- Tariff worries rattled Wall Street again Thursday, pushing the S&P 500 into a correction that left it at the lowest in six months.
Most Read from Bloomberg
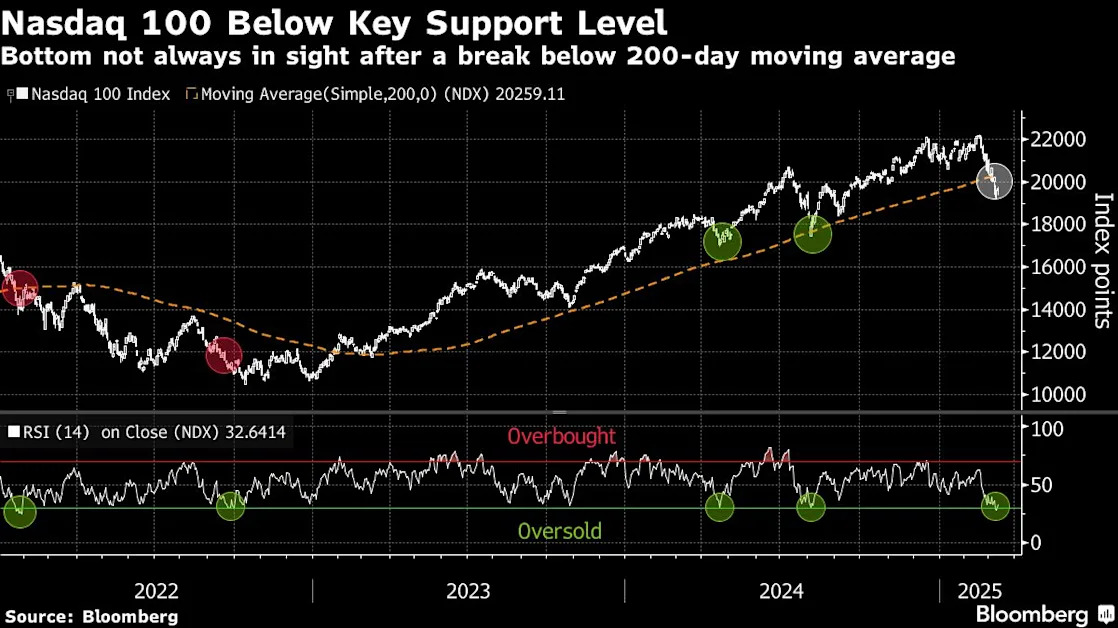
The S&P 500 fell 1.4% on the day, bringing its three-week rout past 10%, a level that meets the technical threshold for a correction. It’s down more than 6% for the year. The tech-heavy Nasdaq 100 Index, also in a correction, tumbled 1.9% on the day. The Dow Jones Industrial Average fell 1.3%, bringing it 9.3% below its last record in December.
The 16 trading sessions it took for the S&P 500 to tumble by this magnitude from its Feb. 19 high marks the seventh-fastest correction in records going back to 1929, data compiled by Bloomberg show. Three of the seven-fastest drawdowns of this magnitude happened under President Donald Trump - in 2018, 2020 and now.
“Most corrections take about two months to play out,” said John Kolovos, chief technical strategist at Macro Risk Advisors. While stocks appear oversold, “we aren’t there yet in terms of time, as it took us about two weeks to get to these levels,” he said.
Among the steepest single-stock declines, Tesla Inc. and Meta Platforms Inc. helped pull the so-called Magnificent Seven stocks down. Adobe Inc. was the worst-performing stock in the S&P 500, falling about 14% on a disappointing outlook.
Investor sentiment is souring even as recent data provided some evidence that the economy remains resilient. The gloom is a sign of just how much Trump’s policies, particularly around trade, have rattled Wall Street nerves. At the same time, waves of firings at federal agencies and deportation threats have eroded confidence in the labor market’s strength.
US stocks have been struggling to regain footing after snapping a two-year uptrend earlier this week. Chart watchers say the S&P 500 needs to recapture its 200-day moving average, which is currently near 5,738. Some technical charts also show the S&P 500 is already at oversold levels. The index’s 14-day relative strength index is hovering around 30, a level that is often considered a technical signal that a selloff has gone too far.
One contrarian signal may give bulls hope. The closely watched bull-bear ratio from the American Association of Individual Investors survey fell to 0.3 in the week through Wednesday, the lowest level since September 2022. The last time the indicator was this low before then was in 2009, in the aftermath of the global financial crisis. Those prior instances have coincided with stretches of bear-market bottoms in US stocks.